Venn Diagram
A diagram that uses overlapping rings or circles to represent sets and their relationships.

The vending (venn) machine only gives out rings.
Example 1
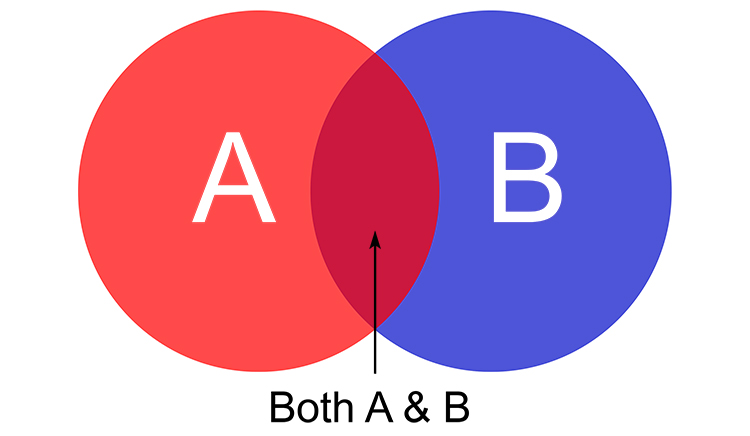
The red section applies to only A and the blue section applies to only B but where the two rings overlap applies to both A and B.
Example 2
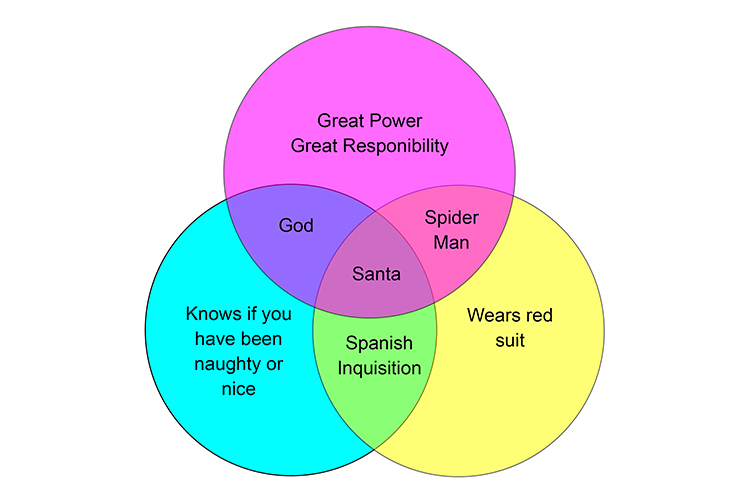
Venn diagrams can have any number of rings or circles.
Example 3
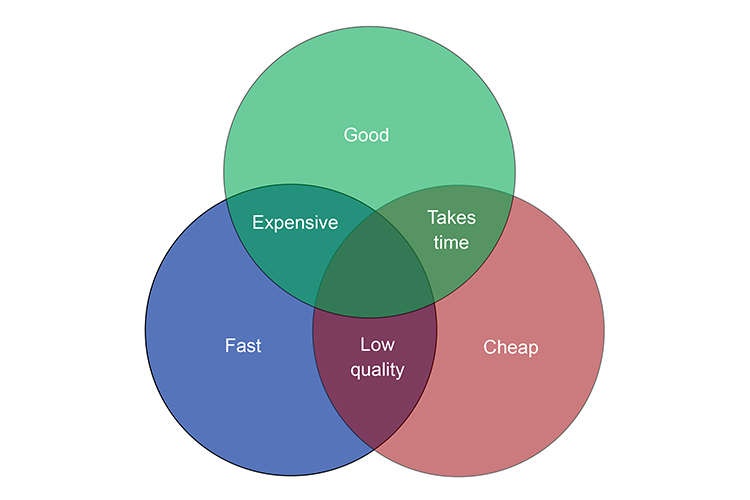
The centre of the above venn diagram where all 3 rings overlap represents the product that is made fast, cheap and good.