level of employment – the percentage of the population of working age that are employed
The term level of employment is self-explanatory as it describes the amount (level) of people that are working (employed) within a population.

The level of employment is a key indicator of the health of an economy. A high level of employment is generally seen as a sign of a healthy economy. However, the level of employment can also be affected by factors such as government policies, demographic trends and the international economic climate.
The following graph gives the level of employment/employment rate figures of the member states of the OECD (Organisation for Economic Co-operation and Development) from 2022.
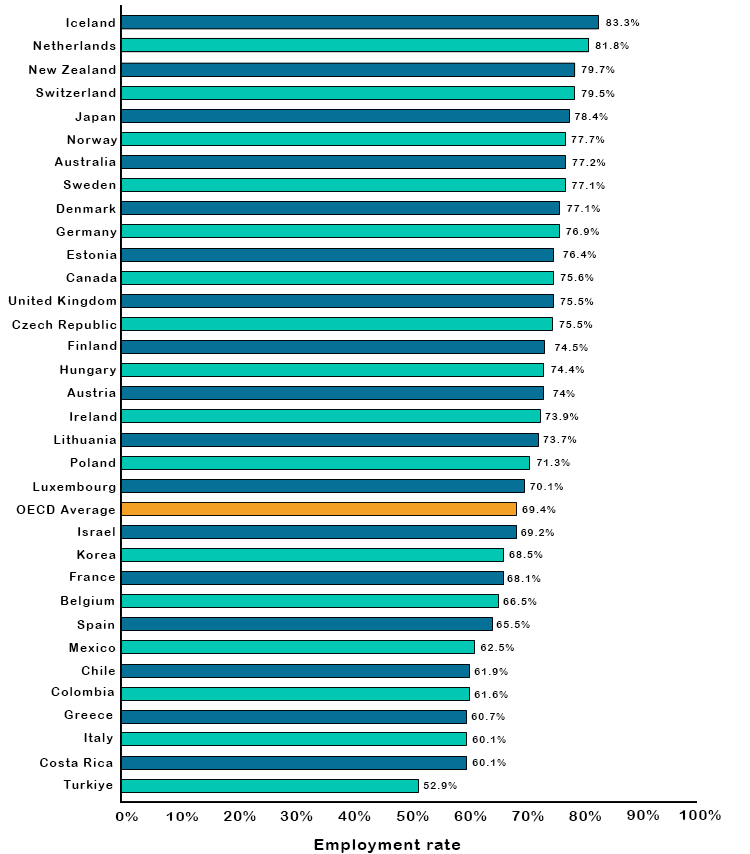
Note: For the UK figure of 75.5%, 4% is the unemployment rate and 20.5% are economically inactive (retired, in education etc). 75.5 + 4 + 20.5 = 100%
As can be seen from this data, countries with largely stable economies form the highest percentage of those positioned above the OECD average figure. Countries positioned below this average are more likely to be in a financially unstable state with a stagnant or shrinking economy.
Although any country’s economic problems are never caused solely by a low level of employment, it does become a symptom and subsequently worsens the impact of economic decline. An example of an economy that was further affected by low levels of employment was that of Greece. In 2013, the employment rate fell to a low of 52% with the unemployment rate at 28.2%. This had a significant impact on the nation’s economic recovery following its debt crisis and subsequent bailout.