Plotting lines on graph paper
Example 1
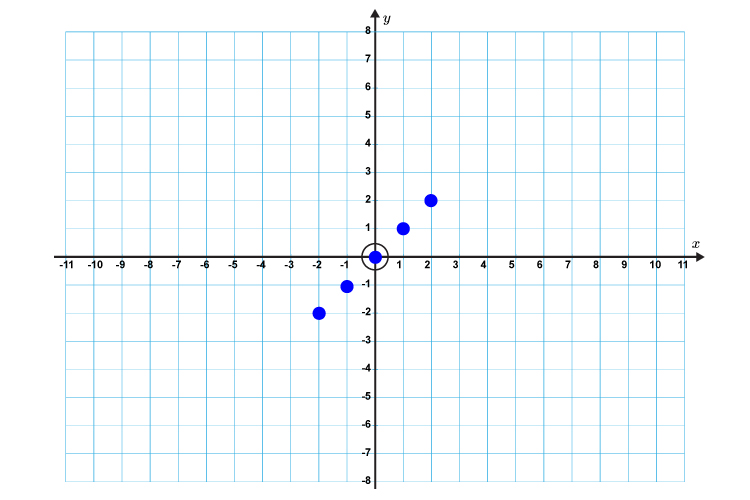
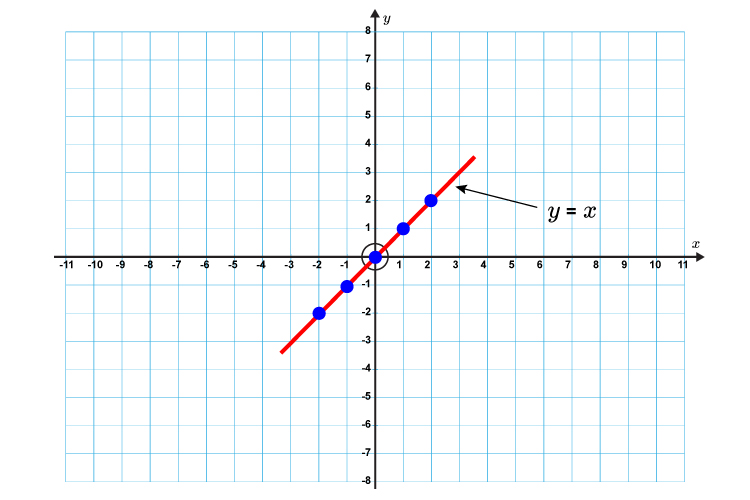
Plot the graph of ` y = x`
This actually means `y=mx+c`
`y=1x+zero`
Graph of `y=x`
First lets calculate some points on the graph.
`x=-2` then `y=-2`
`x=-1` then `y=-1`
`x=0` then `y=0`
`x=1` then `y=1`
`x=2` then `y=2`
Now draw a graph and mark on the above points
Now draw a straight line through these points
Example 2
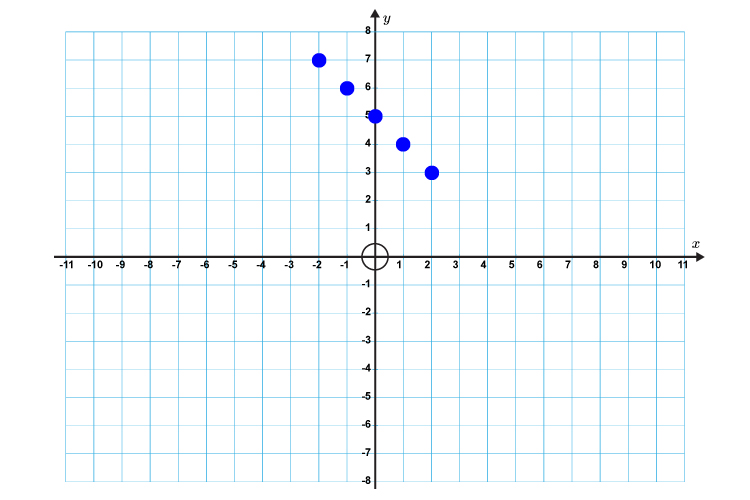
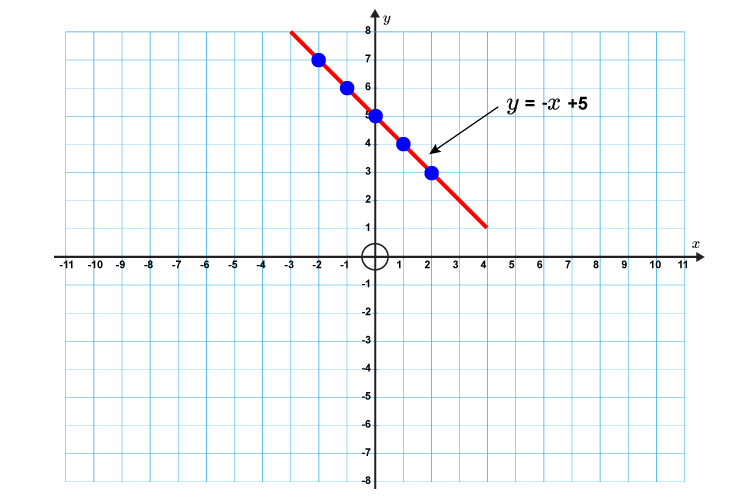
Plot the graph of `y+x=5`
Always put the formula in the form `y=mx+c`
`y=-1x+5`
First lets calculate some points on the graph.
`x=-2` then `y=-1(-2)+5=7`
`x=-1` then `y=-1(-1)+5=6`
`x=0` then `y=-1(0)+5=5`
`x=1` then `y=-1(1)+5=4`
`x=2` then `y=-1(2)+5=3`
Now draw a graph and mark on the above points
Now draw a straight line through these points
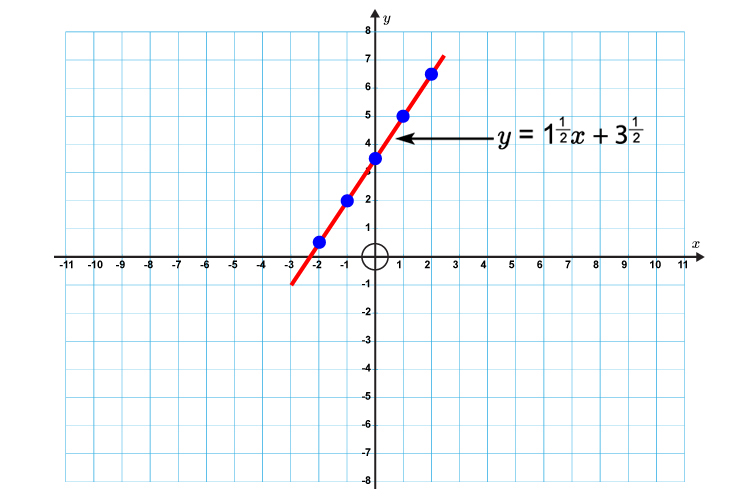
Example 3
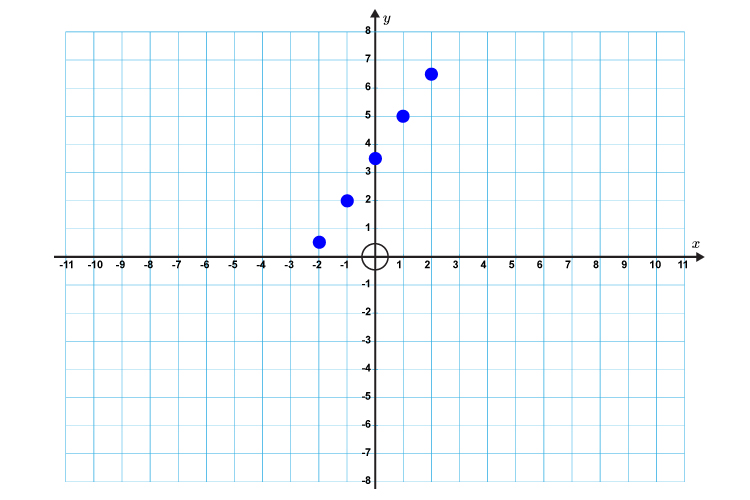
Plot the graph of `2y -3x=7`
Always put the formula in the form `y=mx+c`
`2y=3x+7`
`y=3/2x+7/2`
`y=1\1/2x+3\1/2`
First lets calculate some points on the graph.
`x=-2` then `y=1.5(-2)+3.5=0.5`
`x=-1` then `y=1.5(-1)+3.5=2`
`x=0` then `y=1.5(0)+3.5=3.5`
`x=1` then `y=1.5(1)+3.5=5`
`x=2` then `y=1.5(2)+3.5=6.5`
Now draw a graph and mark on the above points
Now draw a straight line through these points