Bar graph
A pictorial representation of data shown using parallel bars of varying heights. The bars do not touch as the data is about categories.

Bar charts display data but there are gaps between bars (just like in a jail) (there are gaps between the data).
Example 1
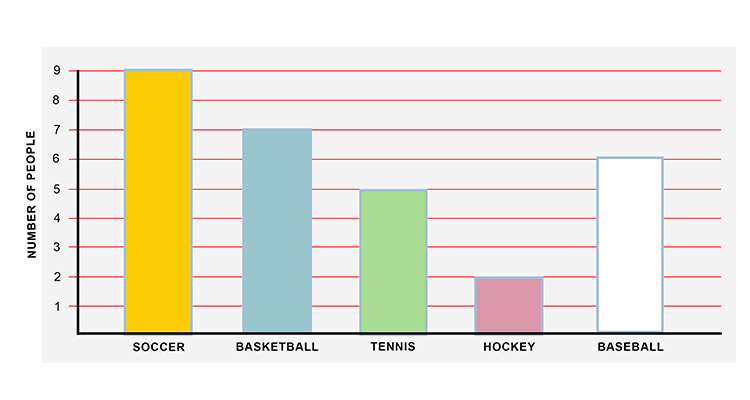
This bar graph has no crossover of sports so in the above bar chart they each have their own category and each bar is separate. The height of a bar shows the number of people who play that sport.
Example 2
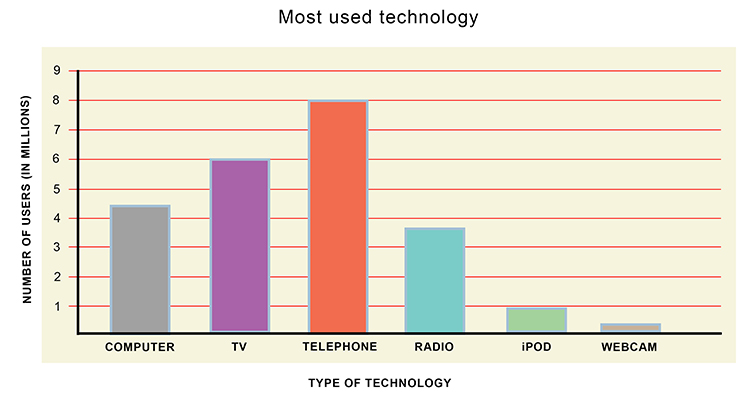
There is clear separation between the bars on the bar graph above.
