Histogram
Histogram – A pictorial representation of data shown in equal intervals. There is no space between the intervals because there shouldn’t be any gaps in the intervals.
A histogram looks like a historical FORT diagram.
Example 1
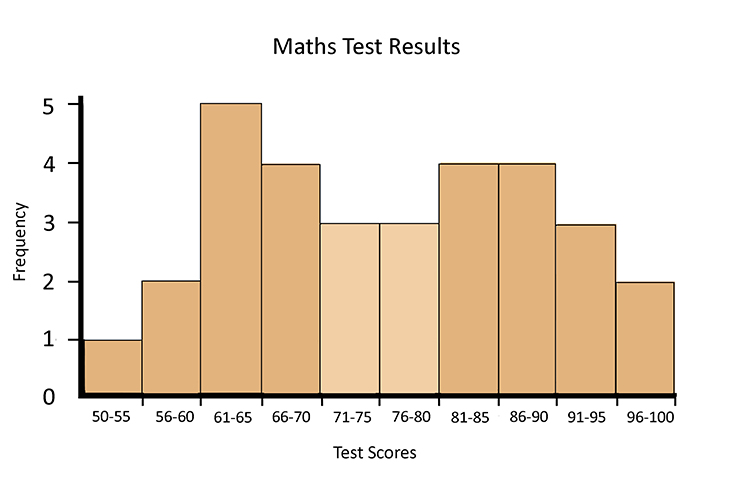
This histogram depicts the maths test scores of students. See how the intervals on the `x` axis go up in set intervals.
Example 2
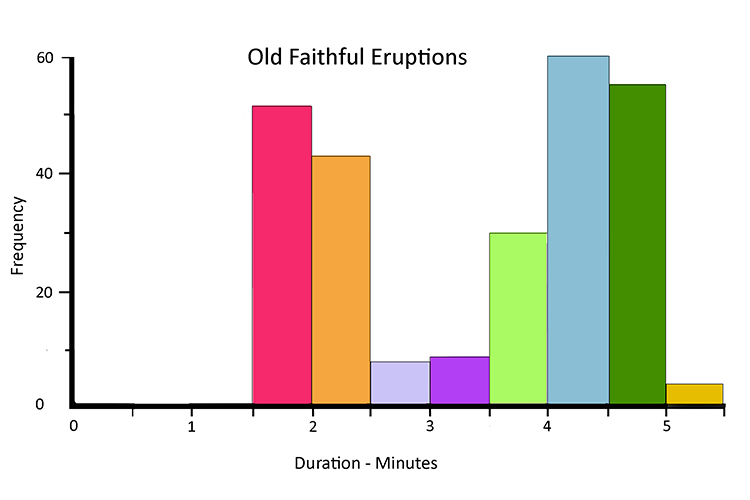
The bar heights on histograms will vary depending on the data but all the bars will touch the adjacent bars.