Hydrograph – A graph which shows the discharge of a river, related to rainfall over a period of time
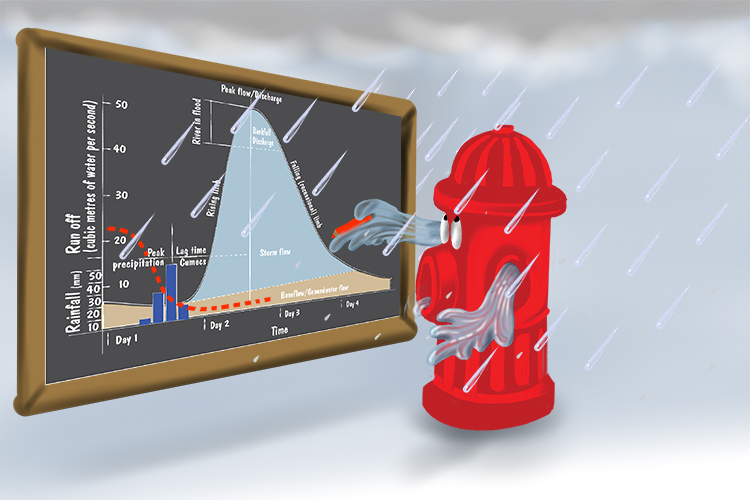
To remember the meaning of the term Hydrograph, use the following mnemonic:
The hydrant drew a graph (hydrograph) of the amount of water that it discharged at different times. When it rained it had to include this water too.
It's a graph that combines the plotting of the water flow rate of a river and the rate of rainfall over time.
Below is the graph of the water flow rate of the river at a particular point along its course:
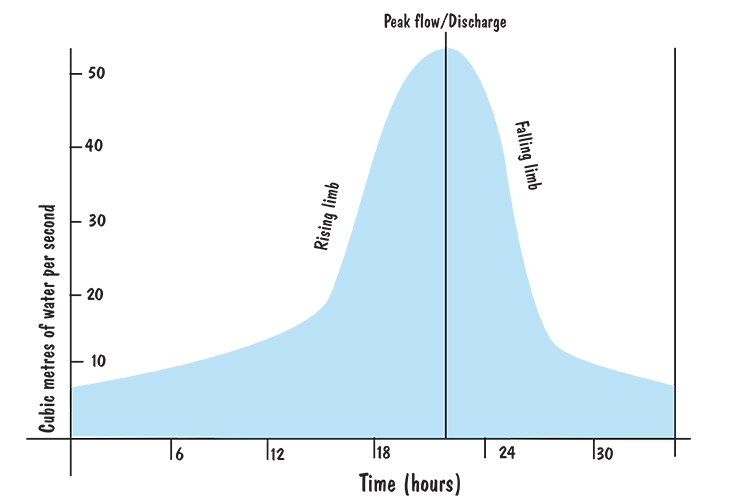
Graph of water flow rate (discharge of a river):
Note: the cubic metres of water per second (also known as "cumecs") is calculated by multiplying the cross-sectional area of the river by the average velocity of the river. See Discharge.
Below is the graph of the amount of rainfall during and around this period of time:
Graph of rainfall in the area around the river measured in mm per hour.
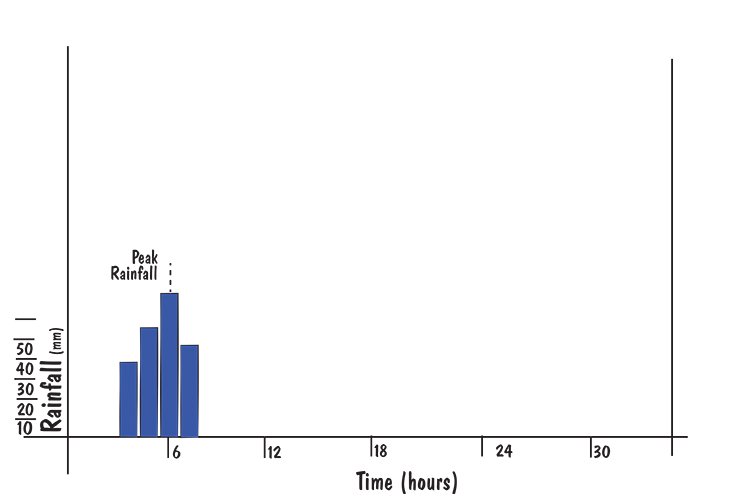
Note: The way this information is collected can be seen in Precipitation.
Meteorologists (weather experts) combine these two graphs to form a single graph called a hydrograph:
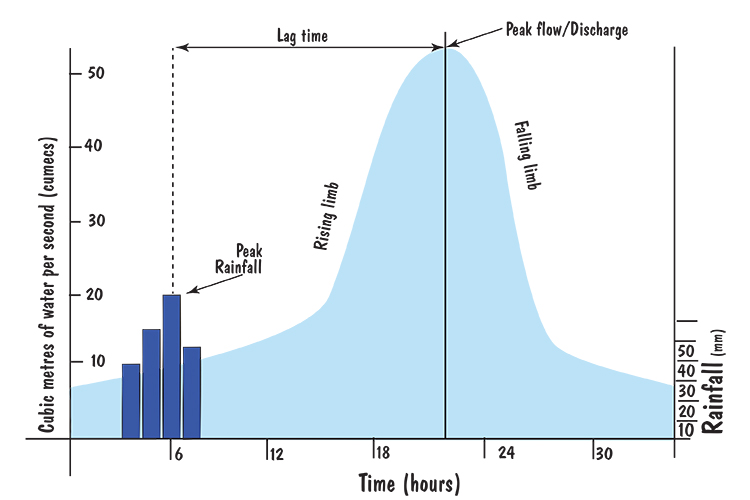
Hydrograph
This hydrograph shows a bar chart of the amount of rainfall per hour measured in mm and a line graph measured in cubic metres of water per second (cumecs) passing a point in a river.
The peak rainfall is the time of highest rainfall but there is a delay between that and the peak discharge of the river. This delay is because it takes time for the water to find its way to the river.
The difference in time between these two peaks is called the lag time.