Inequalities and graphs example 1
Graph the following inequality.
`x+2y>8`
Subtract `x` from both sides to get `y` on its own.
`x-x+2y>8-x`
`2y>8-x`
Divide both sides by 2 to get `y` on its own.
`(2y)/2>8/2-x/2`
`y>8/2-x/2`
`y>4-x/2`
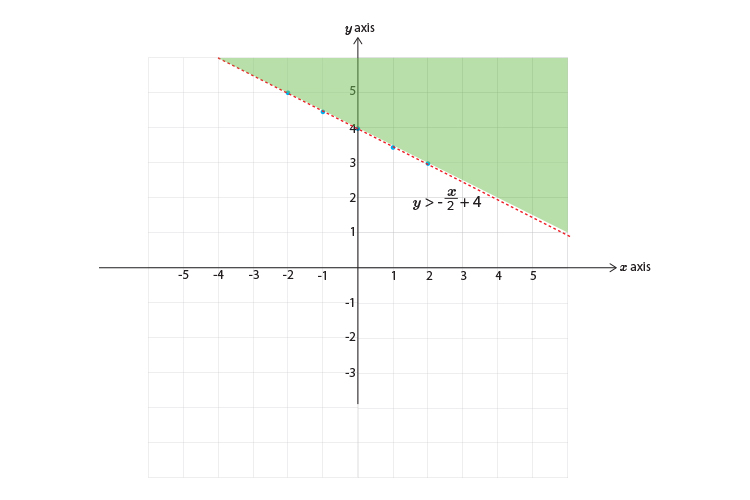
`y>\-x/2+4`
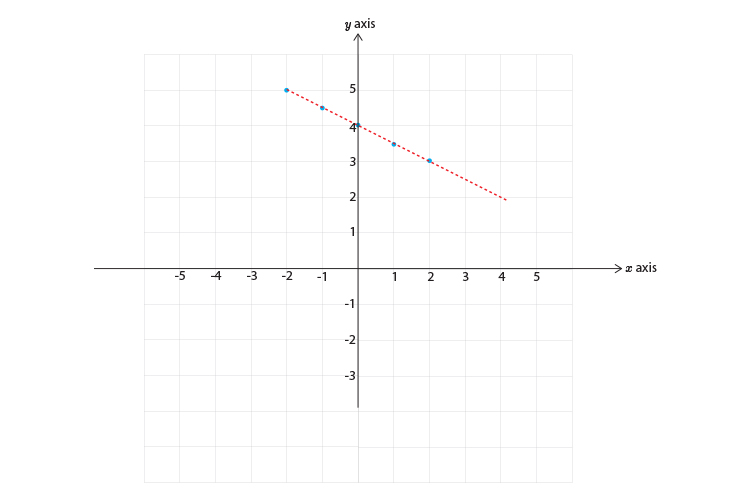
First, let's calculate some points on the graph.
| `x=-2` | then | `y>\-(-2/2)+4=5` | ||
| `x=-1` | then | `y>\-(-1/2)+4=4.5` | ||
| `x=0` | then | `y>\-(0/2)+4=4` | ||
| `x=1` | then | `y>\-(1/2)+4=3.5` | ||
| `x=2` | then | `y>\-(2/2)+4=3` |
Now draw a graph and mark on the above points and don't forget to use just a dotted line.
Now pick a point NOT on the line:
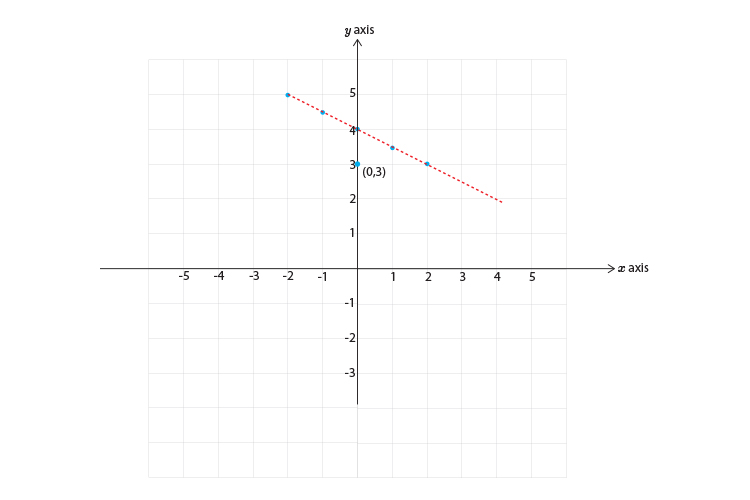
Choose `x=0` and `y=3`
`y>4-x/2`
and `3>4-0/2`
`3>4`
This reads 3 is greater than 4 which is of course incorrect.
So this DOES NOT SATISFY THE INEQUALITY.
DON’T SHADE IT.
Do shade the other side.