Inequalities and graphs example 4
Shade the region on the graph that would satisfy all the following inequalities, label this region R.
`x<3` `y>\-2` `y<\x`
Take each inequality separately
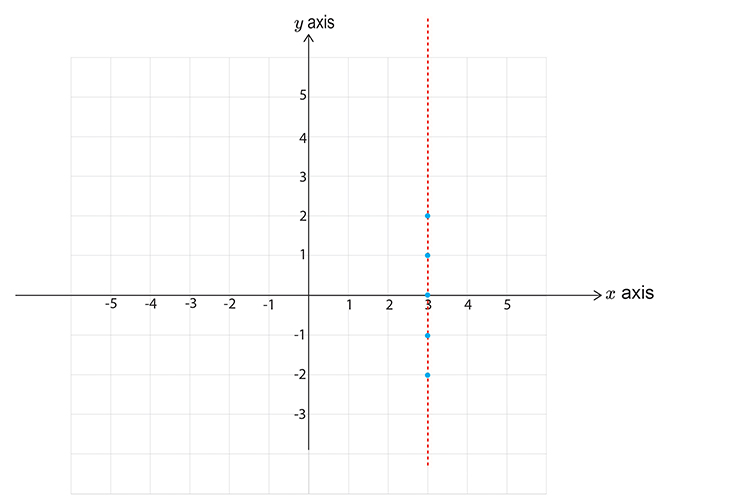
`x<3`
First let’s calculate points on the graph
`y=-2` then `x` is `<3`
`y=-1` then `x` is still `<3`
`y=0` then `x` is still `<3`
`y=1` then `x` is still `<3`
`y=2` then `x` is still `<3`
Now draw a graph and mark the above points.
Don’t forget to use a dotted line.
Now pick a point NOT on the line.
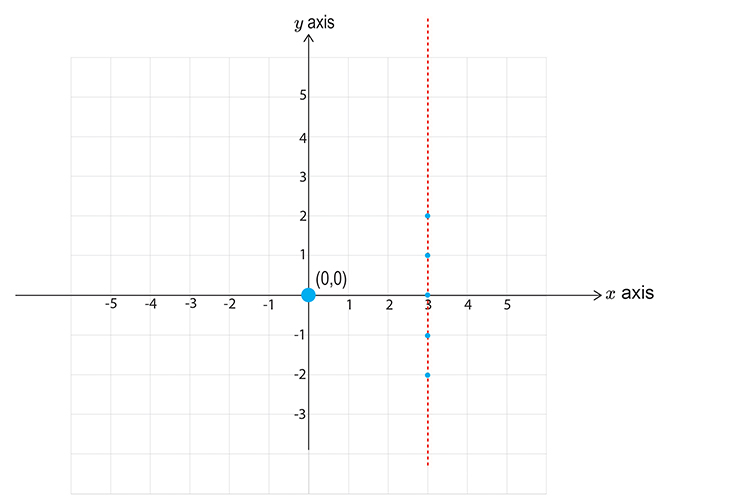
Choose `x=0` `y=0`
`x<3`
`0<3`
This reads zero is less than three.
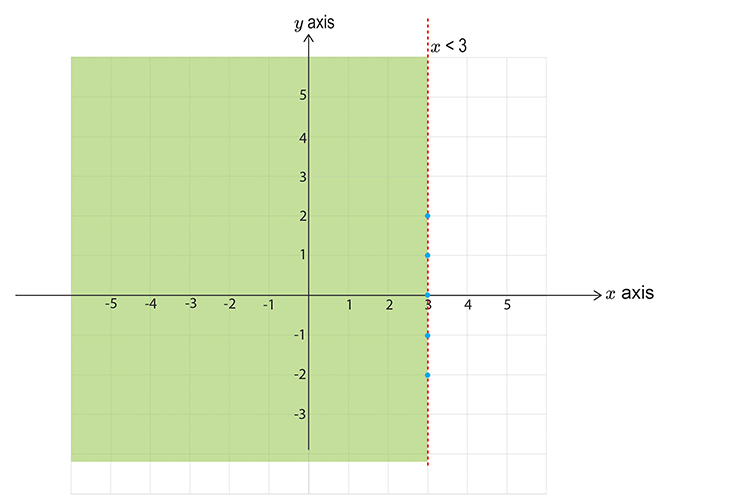
This DOES satisfy the inequality, SHADE IT.
Take the next inequality
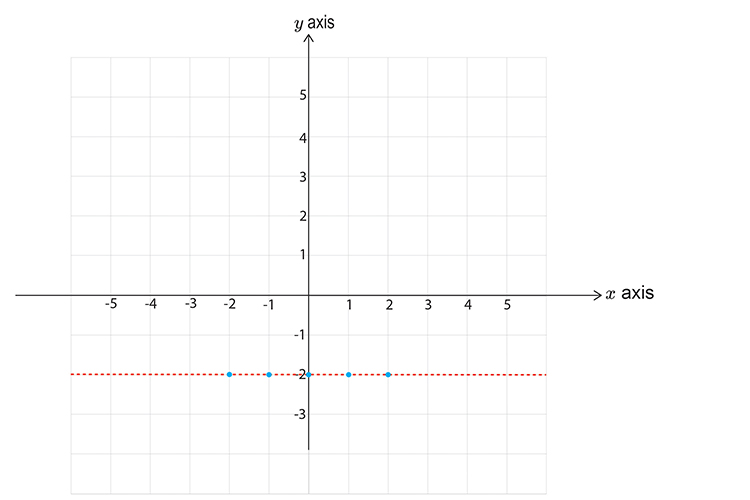
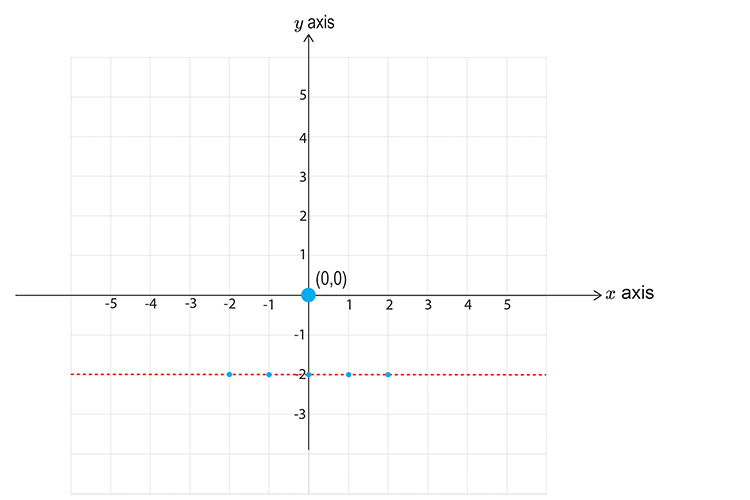
`y>\-2`
First let’s calculate points on the graph
`x=-2` then `y` is `>\-2`
`x=-1` then `y` is `>\-2`
`x=0` then `y` is `>\-2`
`x=1` then `y` is `>\-2`
`x=2` then `y` is `>\-2`
Now draw a graph and mark the above points. Don’t forget to use a DOTTED LINE.
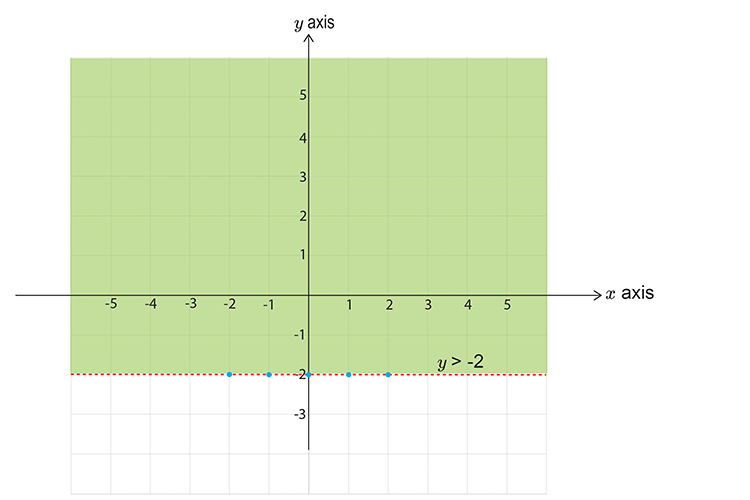
Now pick a point NOT on the line.
Choose `x=0` `y=0`
`y>\-2`
`0>\-2`
This reads zero is greater than minus two.
This DOES satisfy the inequality, SHADE IT.
Take the final inequality
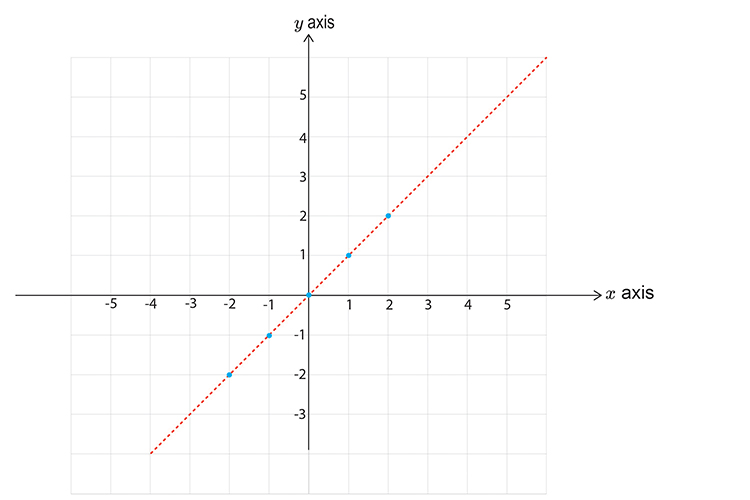
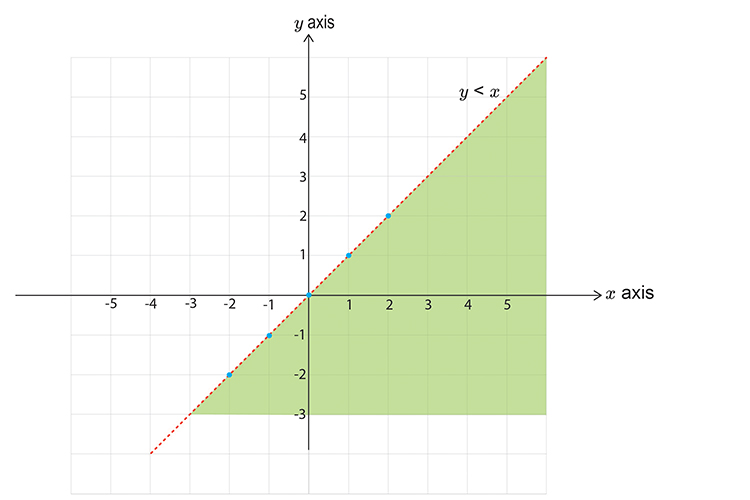
`y<x`
First let’s calculate points on the graph
`x=-2` then `y <-2`
`x=-1` then `y <-1`
`x=0` then `y <0`
`x=1` then `y <1`
`x=2` then `y <2`
Now draw a graph and mark the above points. Don’t forget to draw a DOTTED line.
Now pick a point NOT on the line.
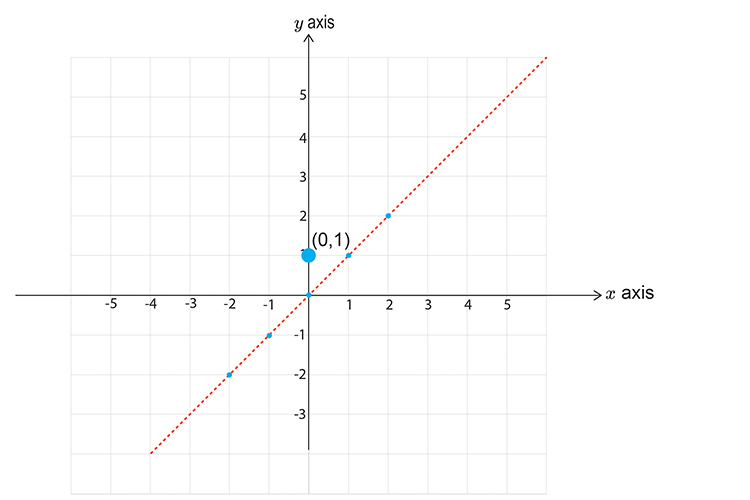
Choose `x=0` `y=0`
`y<\x`
`1<\0`
This reads one is less than zero, which is obviously wrong and therefore this does NOT satisfy the inequality, SHADE THE OTHER HALF.
Now plot all three graphs.
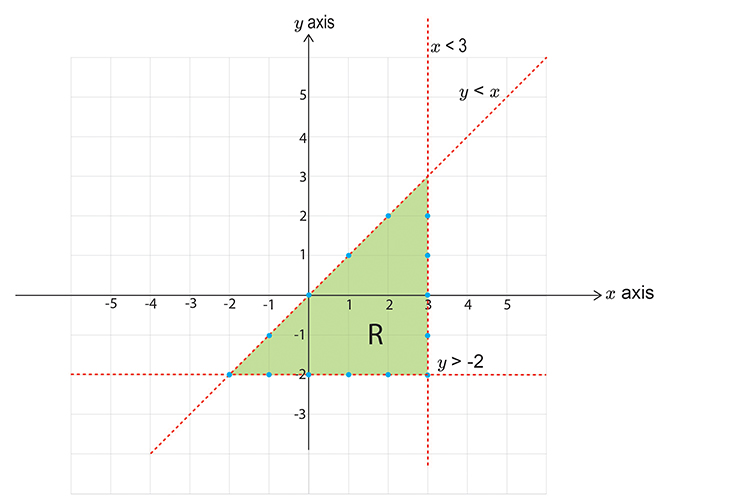
R satisfies all the inequalities.