Inequalities and graphs
Inequalities can be represented on a graph and to do that you only need to know two things:
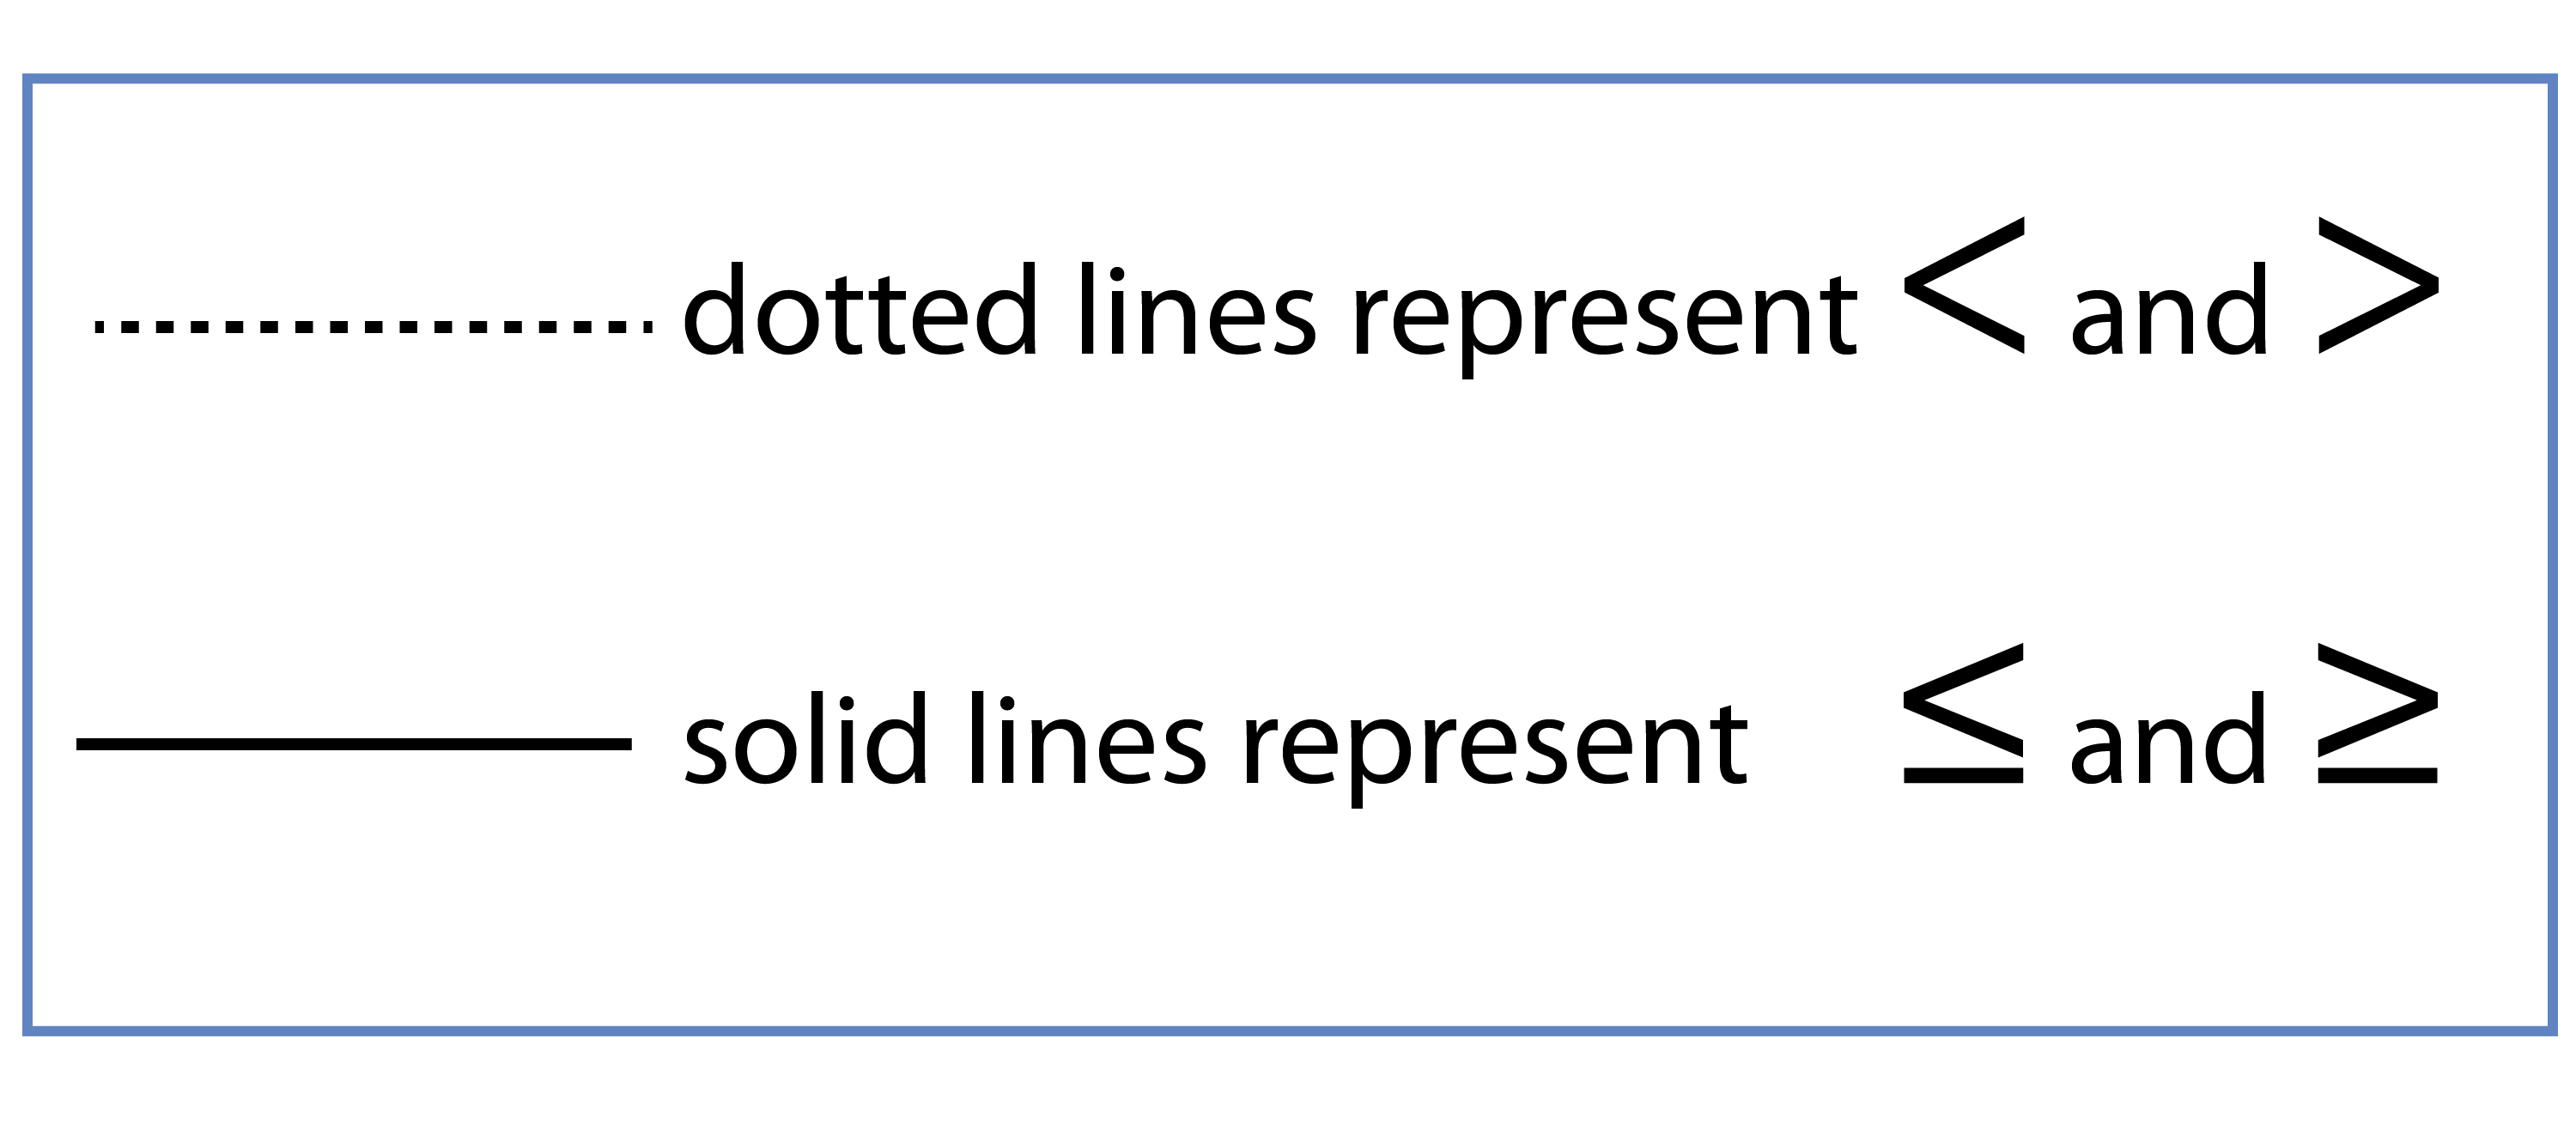
Pick a point NOT on the line
If it satisfies the inequality SHADE IT
If it does not satisfy the inequality
DON'T SHADE IT
(so it must be the other side)
NOTE 1:
We are assuming that when we say “SHADE IT” that that is what the question has asked us to do.
NOTE 2:
In order to draw an inequality graph:
You must understand our section on formula for a straight line.
That is:
1. Always make `y` the subject of the formula
2. Formula of a straight line is `y=mx+c`
3. Plot `x` and `y` guessing values of `x`
