Inequalities and graphs example 5
On a graph mark with a cross (X) six points that satisfy all 3 of the following inequalities
`-2<\x<=1` `y>\-2` `y<\x+1`
Where `y` and `x` are integers.
Take each inequality separately
`-2<\x<=1`
Split this into
`-2<\x`
`x<=1`
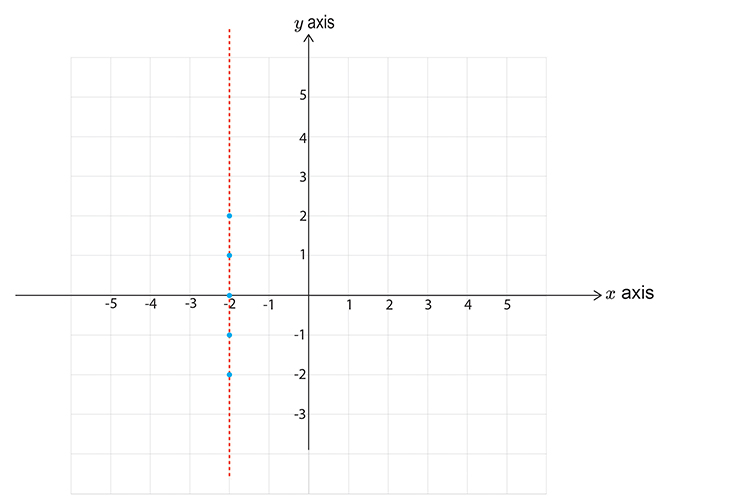
i. `-2<x`
First let's calculate some points on the graph
`y=-2` `x` is greater than -2
`y=-1` `x` is still greater than -2
`y=0` `x` is still greater than -2
`y=1` `x` is still greater than -2
`y=2` `x` is still greater than -2
Now draw a graph and mark these points.
Don’t forget to use a DOTTED line.
Now pick a point not on the line.
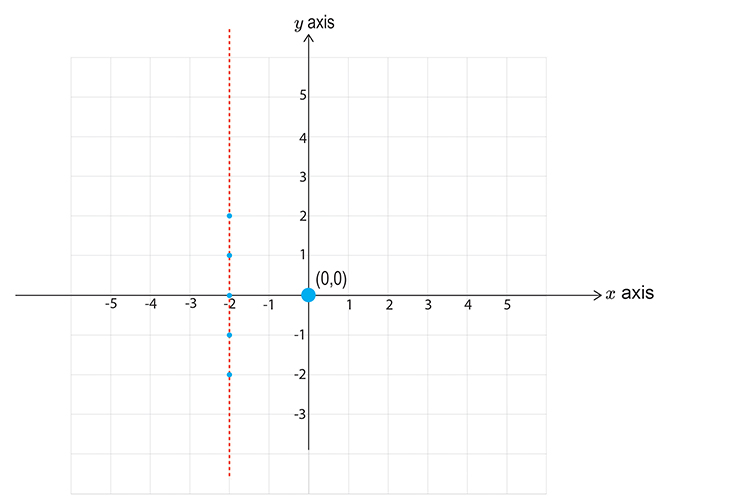
Choose `x=0` `y=0`
`-2<\x`
`-2<\0`
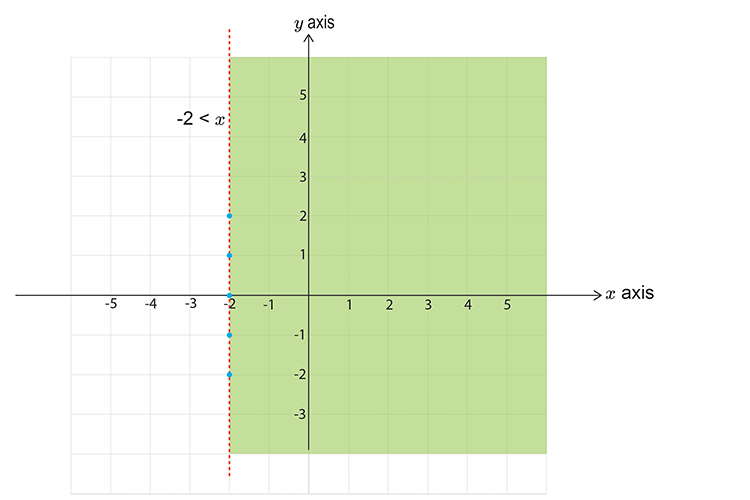
This reads minus two is less than zero, which is correct.
So this DOES satisfy the inequality, SHADE IT.
Now part two
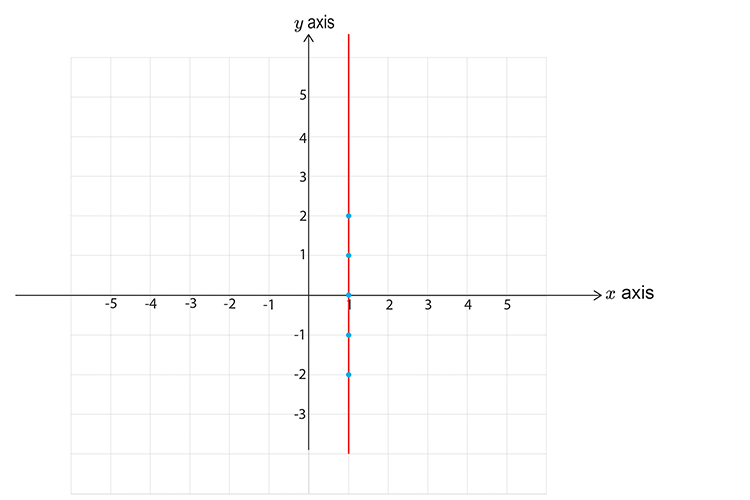
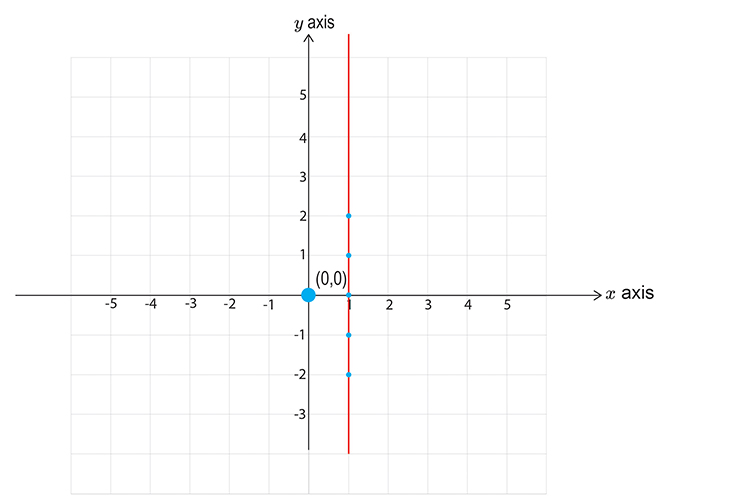
ii. `x<=\1`
First lets calculate points on the graph
`y=-2` `x` is less than or equal to 1
`y=-1` `x` is still less than or equal to 1
`y=0` `x` is still less than or equal to 1
`y=1` `x` is still less than or equal to 1
`y=2` `x` is still less than or equal to 1
Now draw a graph and mark the above points.
Don’t forget to use a SOLID LINE.
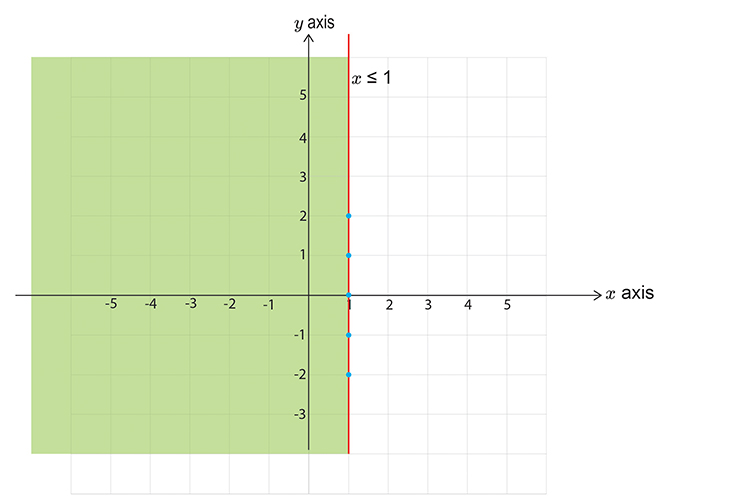
Now pick a point NOT on the line.
Lets choose `x=0` `y=0`
`x<=\1`
`0<=\1`
This reads zero is less than or equal to one, which is correct.
So this DOES satisfy the inequality, SHADE IT.
Now choose the next inequality
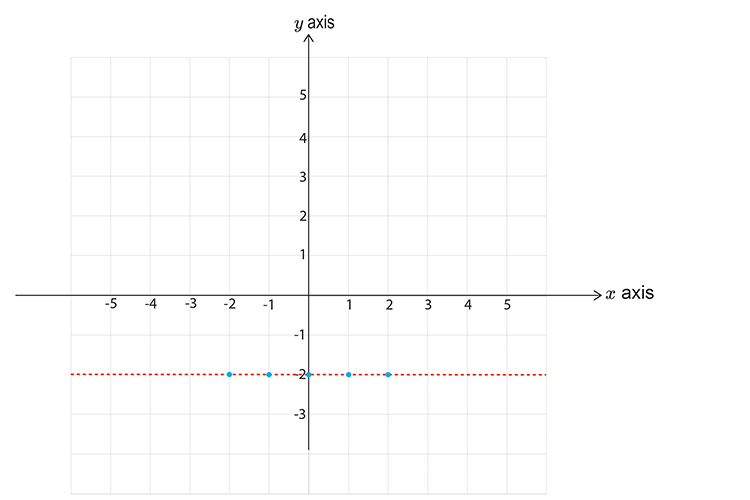
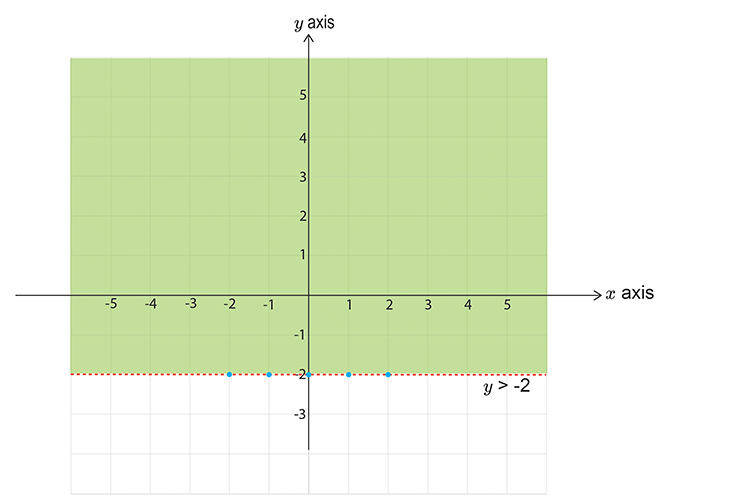
`y>\-2`
First calculate points on the graph.
`x=-2` `y` is greater than -2
`x=-1` `y` is still greater than -2
`x=0` `y` is still greater than -2
`x=1` `y` is still greater than -2
`x=2` `y` is still greater than -2
Now draw a graph and mark the above points.
Don’t forget to use a DOTTED LINE.
Now pick a point NOT on the line.
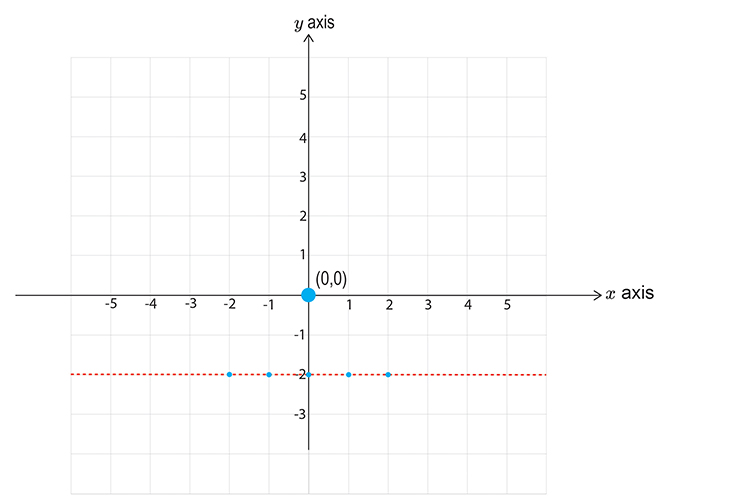
Choose `x=0` `y=0`
`y>\-2`
`0>\-2`
This reads zero is greater than minus two, which is correct.
So this DOES satisfy the inequality, SHADE IT.
Now for the final inequality
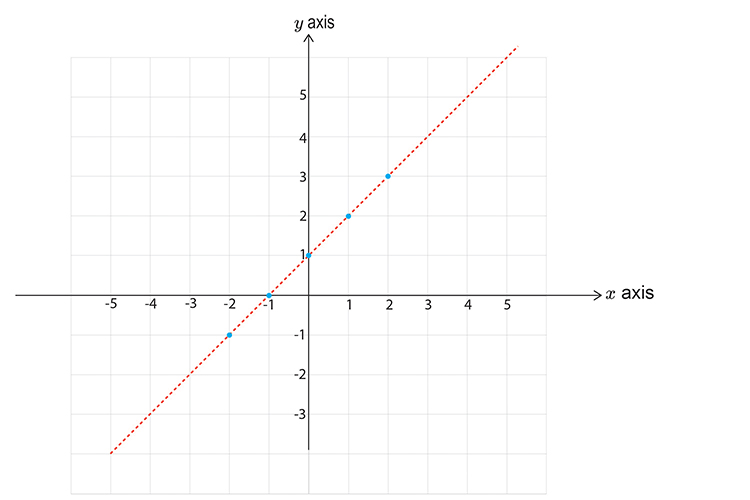
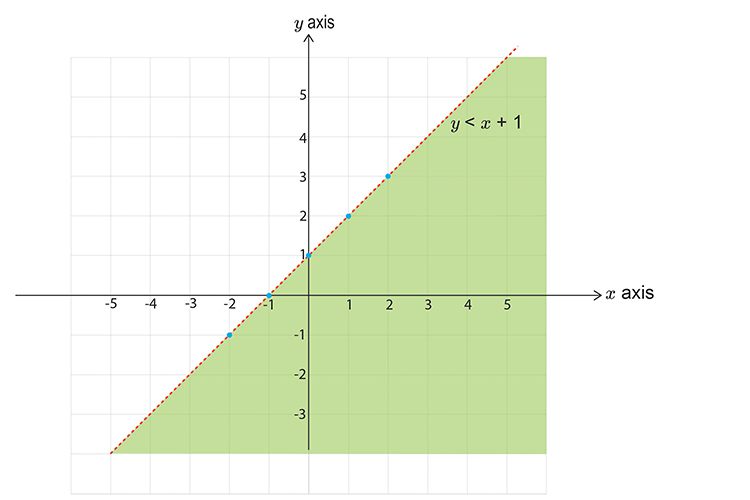
`y<\x\+1`
First let’s calculate points on the graph
`x=-2` `y<-2+1=-1`
`x=-1` `y<-1+1=0`
`x=0` `y<0+1=1`
`x=1` `y<1+1=2`
`x=2` `y<2+1=3`
Now draw a graph and mark the above points.
Don’t forget to use a DOTTED line.
Now pick a point NOT on the line.
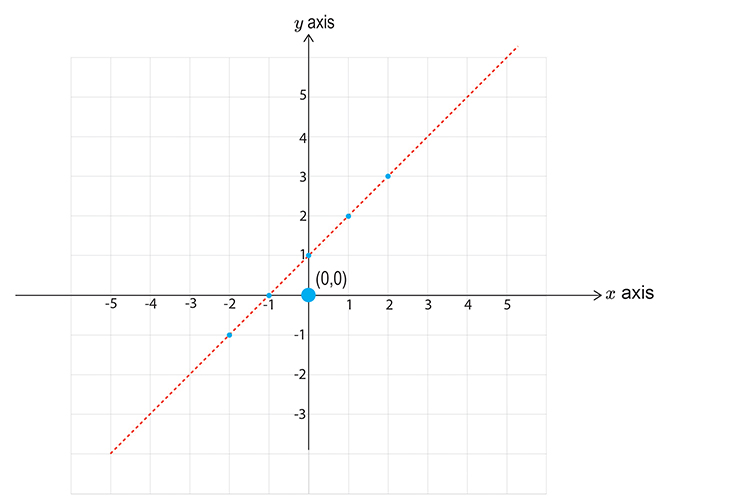
Lets choose `x=0` `y=0`
`y<\x+1`
`0<\0+1`
`0<\1`
This reads zero is less than one, which is correct.
So this DOES satisfy the inequality so SHADE IT.
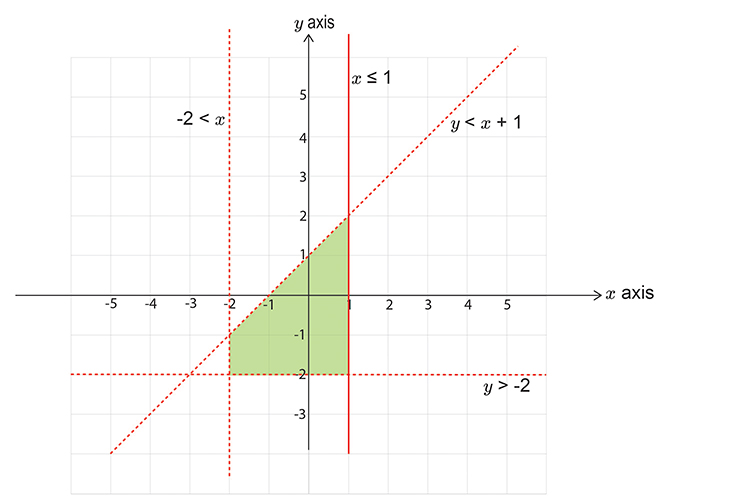
NOW PUT ALL THE GRAPHS TOGETHER. And shade the area that would be covered by all the shaded regions.
Now mark with a cross (x), six points that satisfy all 3 of the inequalities (that are also integers).
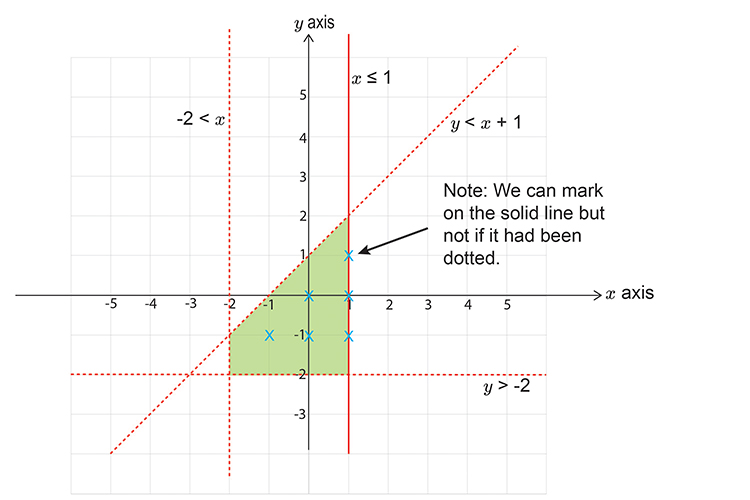
NOTE:
These are the only six points we could have chosen.