Inequalities and graphs example 2
Graph the following inequality:
`4y-x<=4`
Add `x` to both sides to get `y` on its own.
`4y-x<=4`
`4y-x+x<=4+x`
`4y<=4+x`
Divide both sides by 4 to get `y` on its own.
`(4y)/4<=4/4+x/4`
`y<=1+x/4`
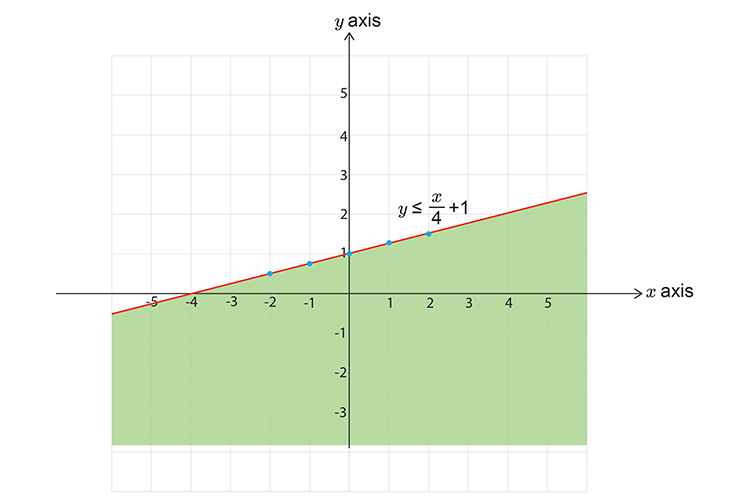
`y<=x/4+1`
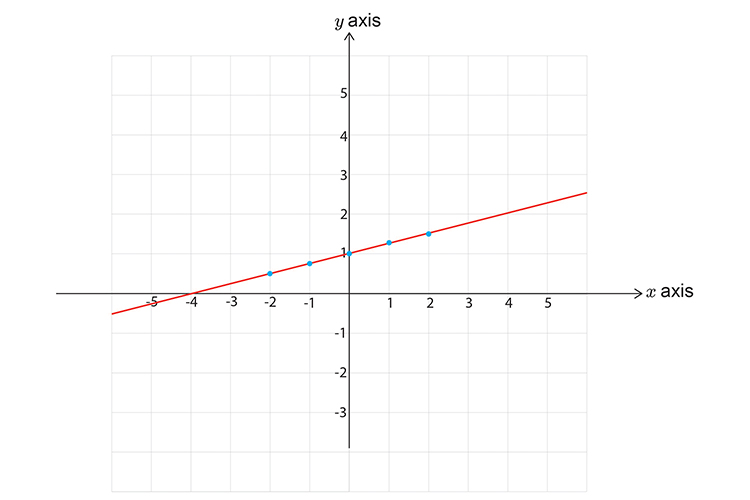
First, let's calculate some points on the graph.
| `x=-2` | then | `y<=(-2/4)+1=(-1/2)+1=1/2` | ||
| `x=-1` | then | `y<=(-1/4)+1=3/4` | ||
| `x=0` | then | `y<=(0/4)+1=1` | ||
| `x=1` | then | `y<=1/4+1=1\1/4` | ||
| `x=2` | then | `y<=2/4+1=1\1/2` |
Now draw a graph and mark on the above points. Don’t forget to use a SOLID line.
Now pick a point not on the line.
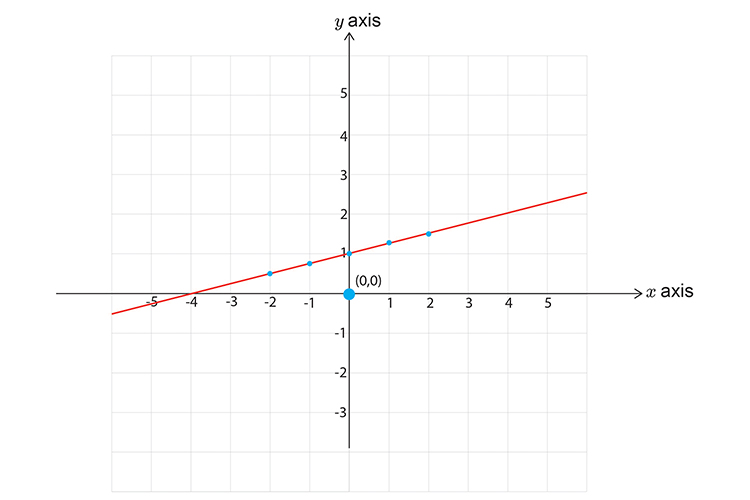
Choose `x=0` and `y=0`
`y<=x/4+1`
`0<=0/4+1`
`0<=1`
This read 0 is less than or equal to 1. This is obviously correct.
This DOES satisfy the inequality.
SHADE IT.