Demographic Transition Model – A model showing how populations should change over time in terms of their birth rates, death rates and population size
To remember the meaning of the term Demographic, use the following mnemonic:
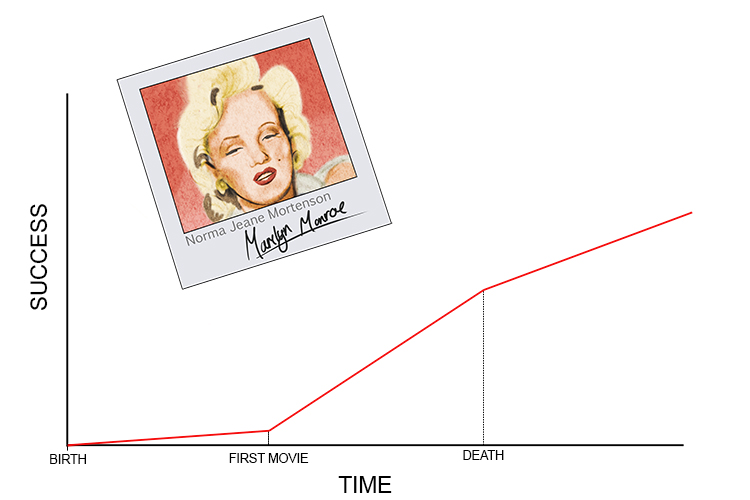
Above we demonstrate graphically the transition of a beautiful model (demographic transition model) from birth (birth rate) to how popular (population size) she became up to her death (death rate) at only 36.
This reminds you that a demographic transition model is a graph showing the birth rate, death rate and population size over time, as below:
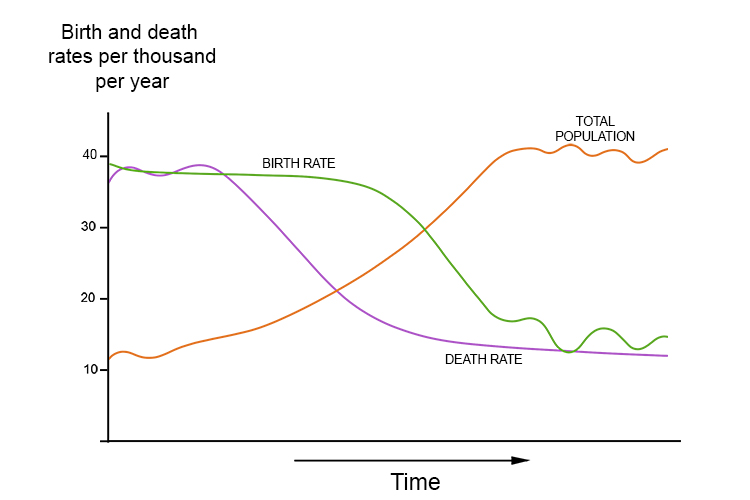
A demographic transition model shows how the population of a country changes as the country develops over time.
The model is divided into several stages:
Stage 1: Birth rate and death rate are high – low natural increase, low total population
Stage 2: Birth rate is high, death rate is falling – high natural increase (population growth)
Stage 3: Falling birth rate, low death rate – high natural increase (population growth)
Stage 4: Birth rate and death rate are low – low natural increase, high total population
A demographic transition model does not take into account migration.
Studying how populations change helps governments in their forward planning for services like childcare, education and care of the elderly.